Domain Coloring
Visualizing complex functions
By Juan Carlos Ponce Campuzano, 15/July/2018
Introduction
Domain coloring is a method that allows us to represent complex functions by assigning a color to each point of the complex plane. The method involves basically two main ideas:
- Assign a color to every point in the complex plane.
- Color the domain of $f$ by painting the location $z$ with the color determined by the value $f(z)$.

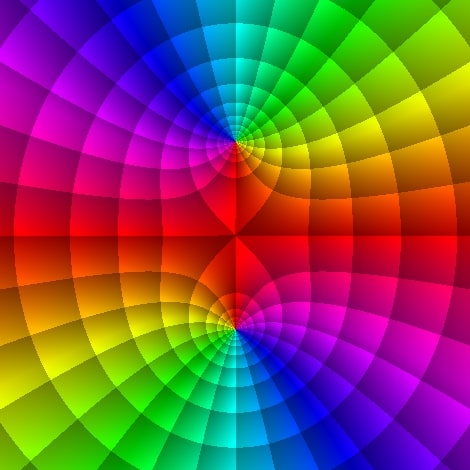
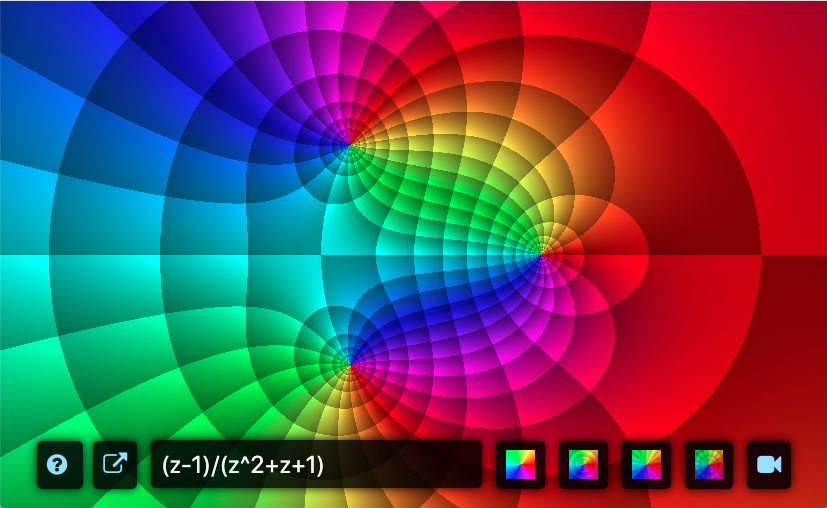
It is common to use the color wheel because it is easy to match the HUE values with the phase (argument) of a complex number $z$ which is usually defined in the interval $[0,2\pi)$, or $(-\pi, \pi]$.
To implement this method in the computer consider a rectangular region of pixels on the screen. This will be a discretized domain $D_h$ for the function $f$. Every pixel $i$ is identified with a complex number $z_i$ where $f$ is evaluated. Then calculate the phase of the value $f(z)$ and its corresponding color. Finally assign the resulting color to that pixel. This procedure is shown in the animation below.
Here you will find a set of tools to visualize and explore complex functions using different color schemes and also a gallery containing a wide range of examples.
If you want to know all the details about the implementation in JavaScript, check the source code available at GitHub. If you find useful these tools or found some issues, please let me know: jcponcemath@gmail.com
Finally, if you find this content useful, please consider supporting my work using the links below.
∞ Thanks!
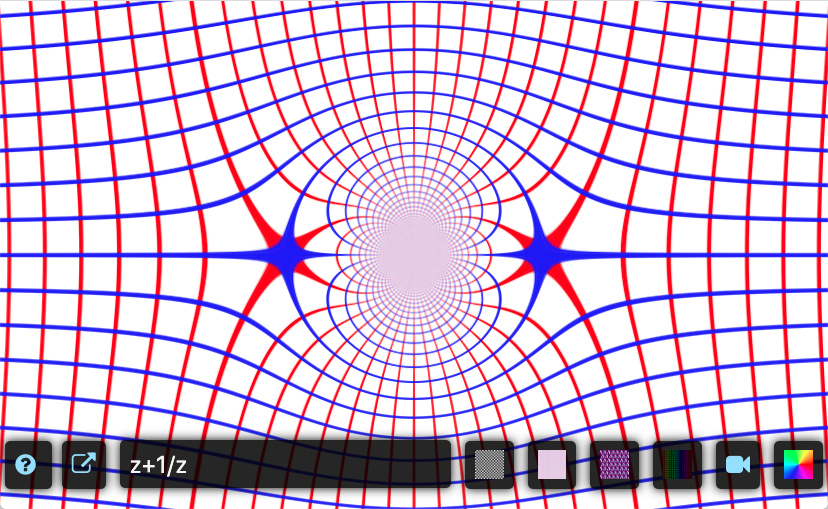
Basic tools
Click on image to open tool!
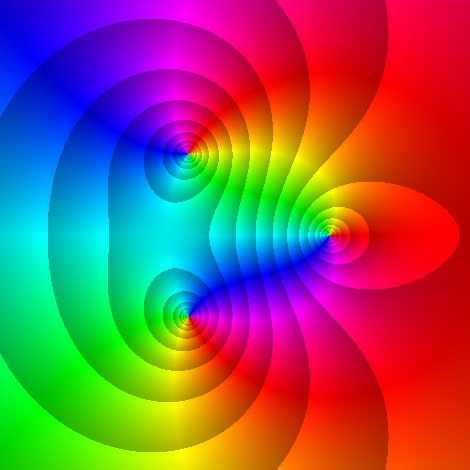
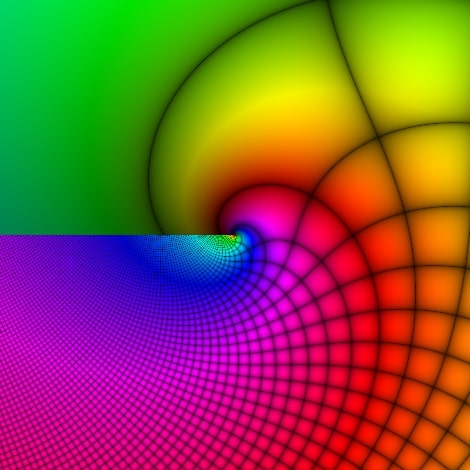
Modulus & Phase
Real & Imaginary components
Modulus & Phase
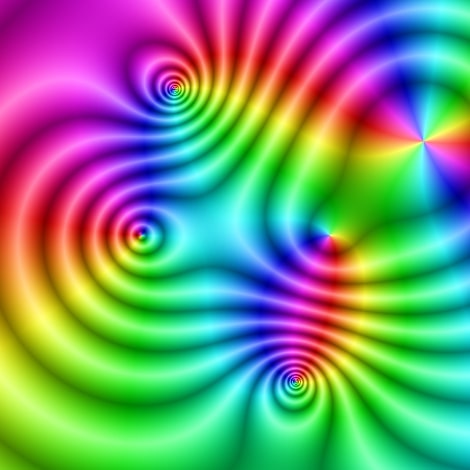
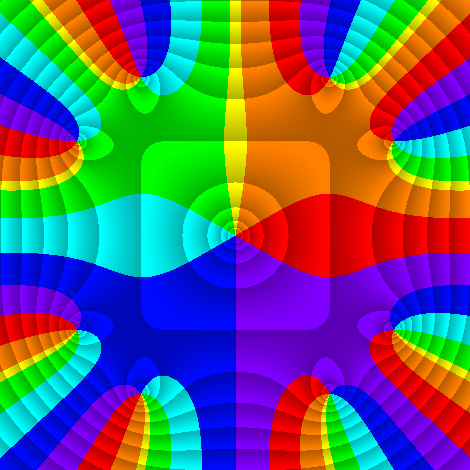
Advanced tools
Click on image to open tool!
JavaScript
Modulus & Phase
Real & Imaginary components
Modulus
Modulus & Phase
Mod/Pha/Re/Im
Modulus & Phase

Plain HSL
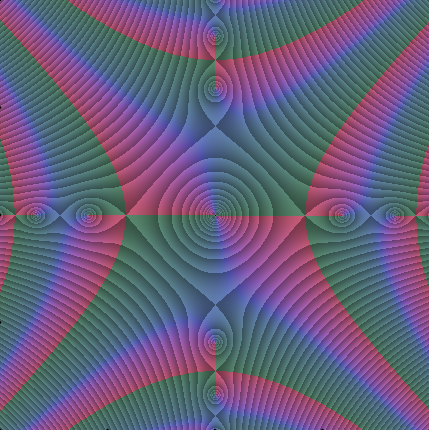
HSLuv Modulus & Phase
WebGL
Real & Imaginary components
Modulus & Phase
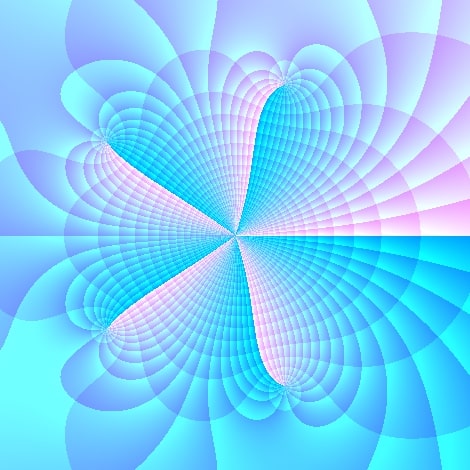
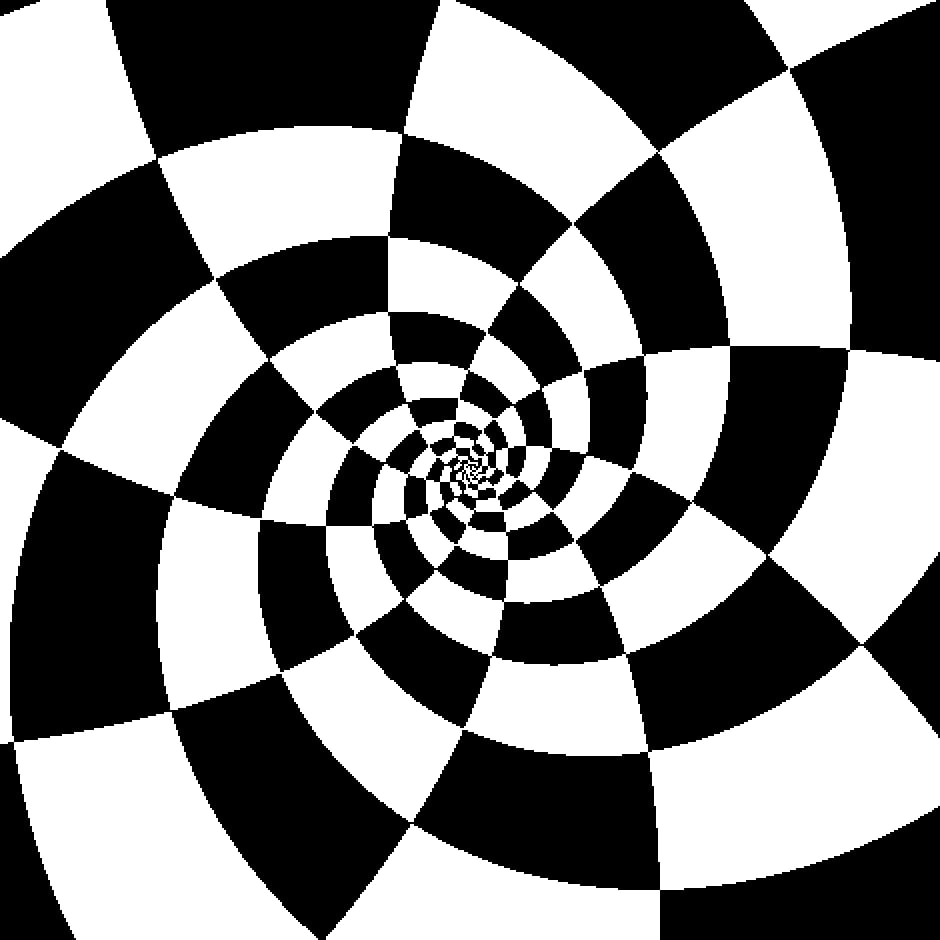
Visit the Gallery
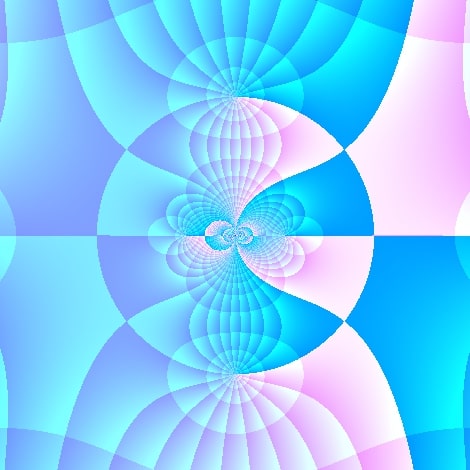
Click on the flower below to enter
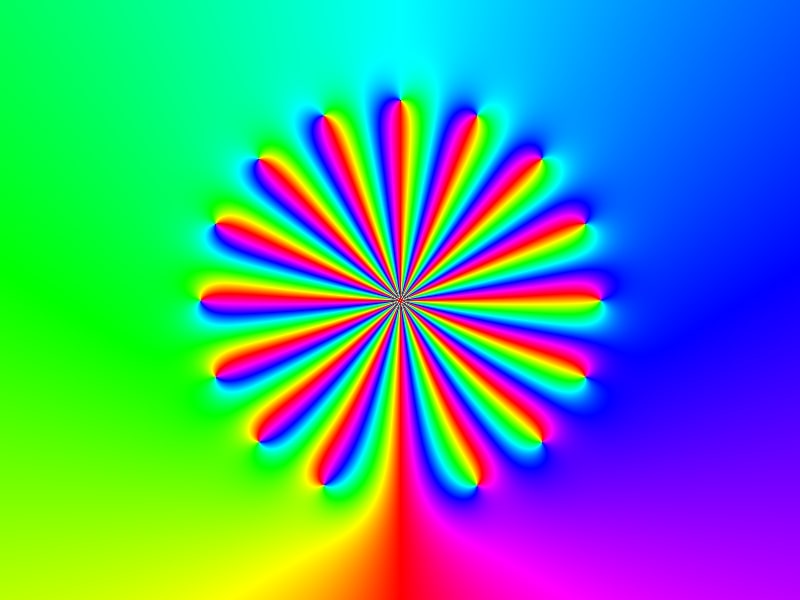
$f(z)=\dfrac{1/(iz)^{18}-1/(iz)}{1/(iz)-1}$
References
- Ablowitz, M. J. & Fokas, A. S. (2003). Complex variables: introduction and applications (2nd ed). Cambridge University Press.
- Breda, A. Trocado, A. & Santos, J. (2013). O GeoGebra para além da segunda dimensão. Indagatio Didactica, 5(1). Accessed 12 June 2018
- Davis, J. E. (2017). Complex Domain Coloring, Available online
- Crone, L. (s.f) Color graphs of complex functions.
- Farris, F. (1998). Review of Visual Complex Analysis. By Tristan Needham. The American Mathematical Monthly, 105(6), 570-576.
- Farris, F. A. (n.d.). Visualizing complex-valued functions in the plane.
- Farris, F. A. (2017). Domain Coloring and the Argument Principle. PRIMUS 27:8-9, 827-844, DOI: 10.1080/10511970.2016.1234526
- Losada Liste, R. (2014). El color dinámico de GeoGebra. Gaceta De La Real Sociedad Matematica Española, 17, 525–547, Madrid.
- Lundmark, H. (2004). Visualizing complex analytic functions using domain coloring.
- Needham, T. (1997). Visual Complex Analysis. Oxford University Press, Oxford.
- Marsden, J. E. & Hoffman, M. J. (1987) Basic Complex Analysis. (2nd ed.) W. H. Freeman and Co, New York.
- Poelke, K. & Polthier, K. (2012) Domain coloring of complex functions: An implementation-oriented introduction. IEEE Computer Graphics Math & Applications 32(5), pp. 90-97, DOI: 10.1109/MCG.2012.100
- Ponce Campuzano, J. C. (2021) Domain colouring for visualising and exploring the beauty of complex functions. Australian Mathematical Society Gazette. Vol. 48, No. 4, pp. 162-170.
- Ponce Campuzano, J. C. (2019) The use of phase portraits to visualize and investigate isolated singular points of complex functions Journal International Journal of Mathematical Education in Science and Technology. 50(7), pp. 999-1010, DOI: 10.1080/0020739X.2019.1656829
- Thaller, B. (1998). Visualization of complex functions, Mathematica J., Vol. 7, issue 2,
- Velleman, D. J. (2015). The Fundamental Theorem of Algebra: A Visual Approach. The Mathematical Intelligencer. 37, 12–21.
- Wegert, E. (2010). Phase diagrams of meromorphic functions. Computational Methods and Function Theory. 10, 639-661.
- Wegert, E. (2012). Visual Complex Functions: An introduction with phase portraits. New York: Springer Basel.
- Wegert, E. (2016). Visual exploration of complex functions. In T. Qian and L. R. Rodino (eds.), Mathematical analysis, probability and applications – Plenary Lectures SPMS (Vol. 177. pp. 253–279). Switzerland: Springer International Publishing.
- Wegert, E. & Semmler, G. (2011). Phase plots of complex functions: a journey in illustration. Notices American Mathematical Society, 58, 768-780.
- Wikipedia: Domain Coloring